‘You are having a wet dream Abraham. There is no way the FCA wrote this stuff.’
Those were my first thoughts as I read the FCA’s interim report on its asset management market study.
If a wet dream isn’t your thing, don’t worry, the report will give you far more pleasure. Possibly. It’s not one of those regulatory reports that cure your insomnia. On the contrary, it’s full of stuff that should keep asset managers (and investment consultants, platforms, advice networks and fund research firms) awake at night.
In this post, I want to pick on a few key points around performance, pricing and profitability. Keep your eyes peeled for my thoughts on the implications for platforms and advice firms.
On Performance
The FCA notes;
“Overall, our evidence suggests that actively managed investments do not outperform their benchmark after costs. Funds which are available to retail investors underperform their benchmarks after costs – while products available to pension schemes and other institutional investors achieve returns that are not significantly above the benchmark.
Investors may choose to invest in funds with higher charges in the expectation of achieving higher future returns. However, we find that there is no clear relationship between price and performance – the most expensive funds do not appear to perform better than other funds before or after cost”.
OK, maybe I’m a bit daft but did the regulator just suggest active funds aren’t worth forking out for?
The abysmal performance of active management has been widely researched and discussed but to have the regulator publicly acknowledge it is a bit like that moment your 5-year-old finds out that Santa isn’t real. You are a little shocked but mostly relieved that you never have to lie to them on the issue again!
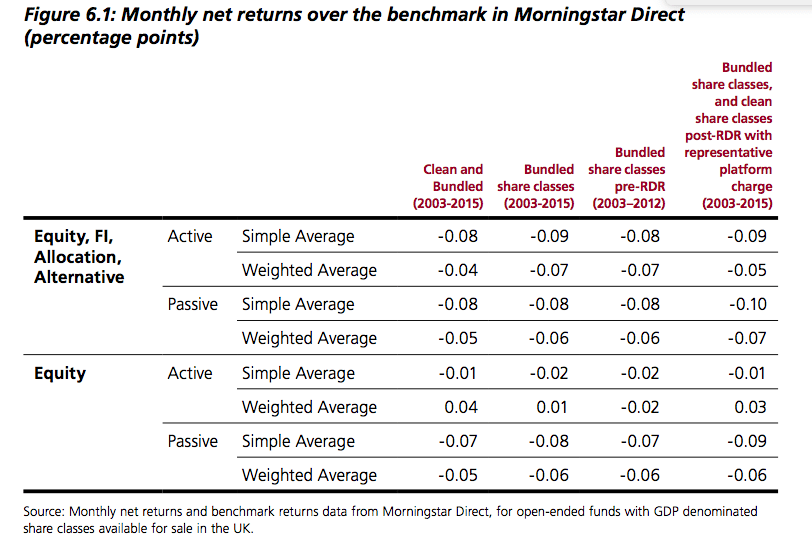
“We considered share classes in the Morningstar dataset which had existed for all, or any part, of the period 2003-15. We calculated monthly net excess returns for each share class, and found the average of these on both a simple average and a money-weighted basis. We undertook this calculation for (i) all equity, fixed income (FI), multi-asset and alternative share classes and (ii) just for equity share classes.
We have found that on average, retail investors in both active funds and passive funds underperformed their benchmarks net of costs. Further, we have found that on average (on both a frequency and money-weighted basis) active and passive funds achieved similar net returns over the 2003-2015 period as shown in Figure 6.1.
The regulator concluded;
“In order for an asset manager to perform better than a passive product in the same investment category, the active asset manager would need to exceed the benchmark by the additional amount charged for the active product. Based on historical data, on average, this means that the active asset manager would need to achieve a return more than 12.5% greater than the market (or an additional 81 basis points per year) in order to outperform against a comparable passive manager”.
I know what you’re thinking.. ‘That’s the average. I’m not looking for the average. I can pick a good fund.’
The FCA has bad news for you. Investment consultants selected by institutional investors (who often have vast resources, talent and expertise ), the almighty Morningstar’s quantitative backward-looking and qualitative forward-looking rating, as well as Best Buy lists peddled by platforms fail miserable to demonstrate they are able to pick the best funds.
“While investment consultants’ due diligence ensures that ‘rated’ asset managers meet minimum quality and operational standards, these ratings do not appear to help institutional investors identify better performing managers or funds. Many institutional investors struggle to monitor and assess the performance of the advice they receive and we also have concerns about whether the interests of investment consultants are in line with investors’ interests.
We analysed whether platform best buy lists help investors identify funds that will outperform funds which are not on the best buy list and funds that will outperform their benchmark. Our analysis of the performance of share classes on best buy lists of D2C platforms shows that, across all categories taken together, they perform better than non-recommended products. This finding holds across different assumed holding periods. However, the average net excess returns of share classes on D2C platform best buy lists were not greater than their benchmarks. Share classes on these lists achieved a net performance with little or no significant excess return over benchmarks.
Share classes awarded a 5-star rating by Morningstar do not significantly outperform their benchmarks net of charges; net-of-fees excess returns are statistically indistinguishable from zero. However, the difference in net excess returns between 5-star rated share classes and non-5-star rated share classes is positive and significant, meaning that 5-star share classes earned greater net excess returns than other share classes. This finding holds if we assume different holding periods of 3 and 5 years.
Share classes awarded a Gold, Silver or Bronze (GSB) Morningstar Analyst rating do not significantly outperform their benchmarks net of charges; net-of-fees excess returns are statistically indistinguishable from zero over various different holding periods. While we found that the difference in net excess returns between GSB Morningstar Analyst rated share classes and non-GSB rated share classes is positive and significant (meaning that 5-star share classes earned greater net excess returns than other share classes), this finding does not hold when we examine 3 or 5 year holding periods.
But never mind, you totally can pick the best funds. You are better than those lot.
On Pricing;
The regulator finds that despite regulation (e.g RDR), increase in number of players in the marketplace, and generally rising AUM, price of active funds remain remarkably resilient. Contrast this to passive funds, where fund charges have fallen by nearly 50% in the last 3 years alone!
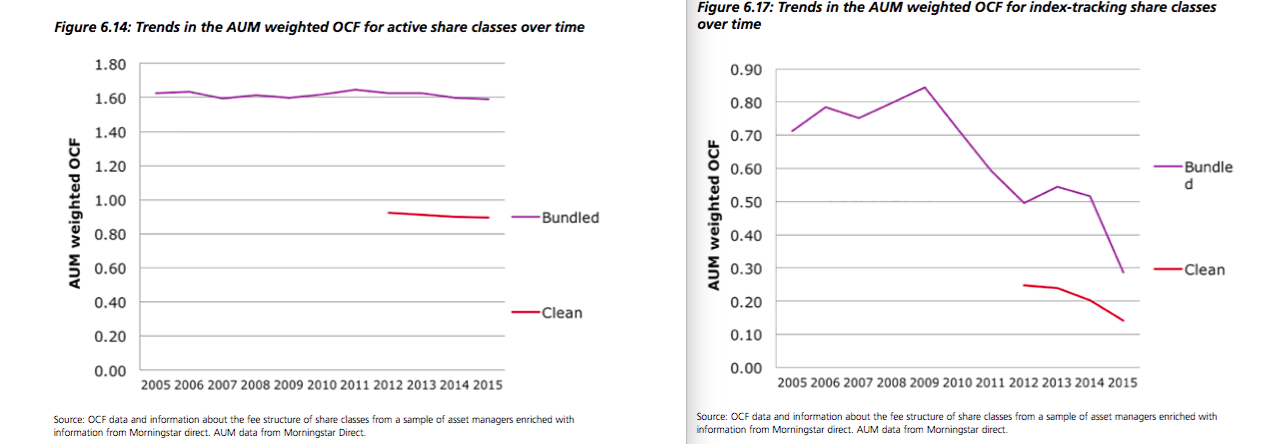
In what parallel universe does an average active fund cost 7 times the average passive fund?
The FCA notes;
“…once assets under management are greater than around £100m prices do not change significantly based on the number of assets under management. This implies that any fund level economies of scale do not get passed on in lower charges to investors”.
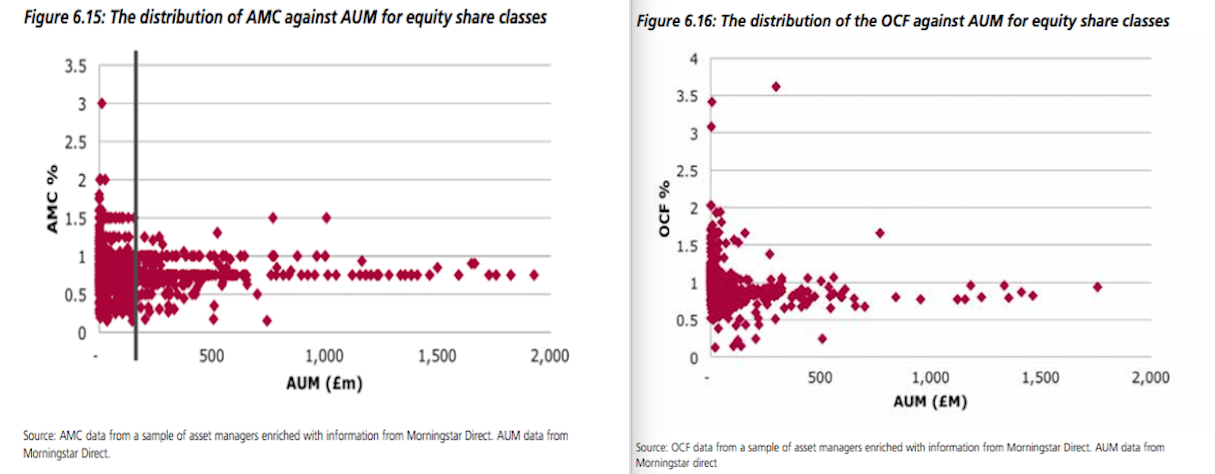
Clearly, this not only shows that competition is ineffective but the interest of asset managers and investors aren’t aligned. As AUM go up, the overall cost to client should come down. Except it doesn’t.
- Profitability
So the FCA discovered that asset managers don’t pass on economies of scale to investors in form of lower fees. I wonder why? May be because ehrrr… ehrrr… asset managers keep all the benefits of scale to themselves!
“We find that profit is also correlated with AUM, as shown in Figure 6.20. Larger firms’ revenue increases as AUM increases, consistent with the ad valorem pricing model (charges are a % of AUM). We also find that whilst costs increase with AUM they do so at a slower rate with larger firms typically making larger profits. We also find that larger firms can benefit from economies of scale with cost per £ AUM falling as AUM increases.
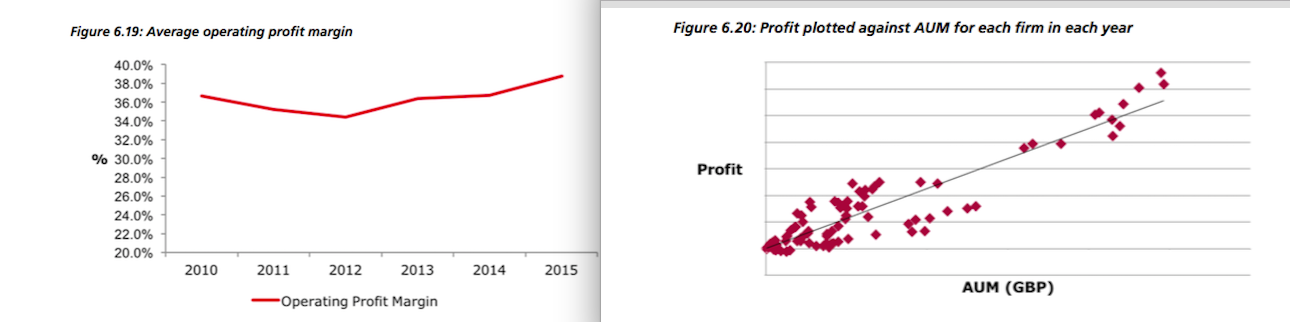
“We find that the operating margin earned by asset managers is significant. As shown in Figure 6.19 below, the money weighted average operating margin across our sample of 16 asset management firms is between 34-39% over 2010 – 2015. Trends in operating margins are variable between firms. For about half of the firms in our sample operating margins are largely flat from 2010-2015. However, for most of the remaining firms, operating margins grew over the period. Typically we find that firms who reported margins below average in the 2010- 2011 period had recovered to close to the industry average in the later periods of the sample”.
So, while most people have to save more and many face prospects of lower income in retirement, the people charged with managing your money are sticking up two fingers up at you and laughing all the way to the bank!
.

He holds a Master’s degree from Coventry University and an alphabet soup of qualifications, including the Investment Management Certificate, Chartered Financial Planner, CFP and Chartered Wealth Manager designations. He was one of 5 finalists for the Professional Advisers Personality of Year Award 2015 but the award went to a more deserving winner, obviously!
Read Full Bio
Abraham, The study deals with performance, which is clearly very important, but fails to look at the risk taken in getting the performances they quote. We look at both active and passives in our research but when taking into account the relative volatility and maximum drawdowns of funds, the passive funds invariable score less well. Perhaps the FCA should have also looked at the information or sharpe ratios as they are always keen for client to invest with a “suitable” level of risk!
Also, if they take an average of all the share classes available for this study, are they then looking at all the different share class prices for one fund and therefore the average is much higher than the lowest share class available which we would all look to use?
I hear you Abraham but I’m also not sure I can think of one single other industry that passes on its economies of scale. For example, when Apple phone sales went through the roof, they definitely didn’t become noticeably cheaper, or cheaper at all.
@ Alex Reynolds
The view that active management protect you from downside is false. Generally active investment management takes more risk to try to outperform. Also measuring risk by volatility is wrong.
There are some funds who have lower volatility for a longer period and but at one moment the volatility increases, sometimes when you do not want this to happen. Now volatility could be associated with stock prices going up (I have not heard anyone complaining about that) and with stock prices going down.
Fundsmith Equity is arguably one of the best Global Equity fund. The fund volatility has increased significantly in the last 3 months and performance has also deteriorated. Obviously it is because it only invests in consumer staples sector and for a long period of time investors were only investing in this sector and IT too bringing these stocks through the roof.
The US economy seems to rebalance a bit and investors have rediscovered value investing. They may be wrong or right, only time will tell. I am not sure when Fundsmith will comeback to winning or if it will comeback in the 1st decile at all.
Information and Sharpe ratios are backward looking ratios, they can offer little information for the future. The future, well the future is uncertain, and stock prices are a random walk. As a result an index fund is best suited to investment.
Morningstar’s quantitative ratings (the Star ratings) are NOT forward looking , they are backward looking. The qualitative ratings (the MEDAL ratings) are forward looking.