Morningstar has a new paper on the Safe Withdrawal Rate (SWR) framework from a UK perspective. This is an excellent addition to the debate on retirement income planning, particularly because it prompts the consumer media to pay attention.
The Morningstar team, led by Head of Retirement Research (US) David Blanchett who has conducted extensive research on the SWR framework and retirement income planning in general in the US, makes an important point that the ‘4% rule’ was created with a US investor in mind, and should not be applied blindly to the UK (or an other country for that matter). This is a point we’ve made in the past as noted in this 2015 article (obviously no one was paying attention!! 🙂 and it’s line with previous research by Wade Pfau (2010) who replicated SWR research in 17 developed countries including the UK. As I noted in a previous post,
Pfau’s results for a 50/50 UK portfolio puts SWR at 3.4%. But if a 10% probability of failure is acceptable, then the SWR is 4.01%. Interestingly, a withdrawal rate of 5% has a failure rate of a whopping 55.6%!
Pfau’s research assumed fund charges and the adviser fees to be 0%. This is of course unrealistic, and if we were to deduct a conservative fee to account for the adviser fee, fund and platform charges, SWR for UK would be closer to 2% than 4%!
So, what’s changed since? Nothing, really.
Morningstar adds an interesting perspective by introducing a fee of 1% portfolio fee (which we’ll have had to account for if we were using Pfau’s research) and a Monte Carlo modelling using a current market valuation model for their return assumptions on asset classes. The image below shows Morningstar’s result using the Dimson, Marsh and Staunton (DMS) historical returns database but with a 1% portfolio fee deducted; 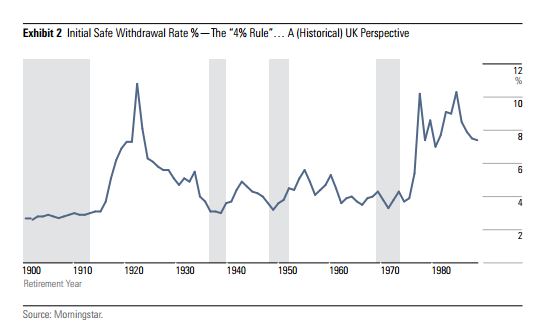
The historical model highlights four particular periods in UK’s 100 years market history where the SWR would have been so low as to warrant no more than 2.5% withdrawal (after 1% fee); those starting a 30-year retirement between 1900-1913, 1937-1939 (bang in the middle of the World Wars), 1947-1952 and 1969-1973.
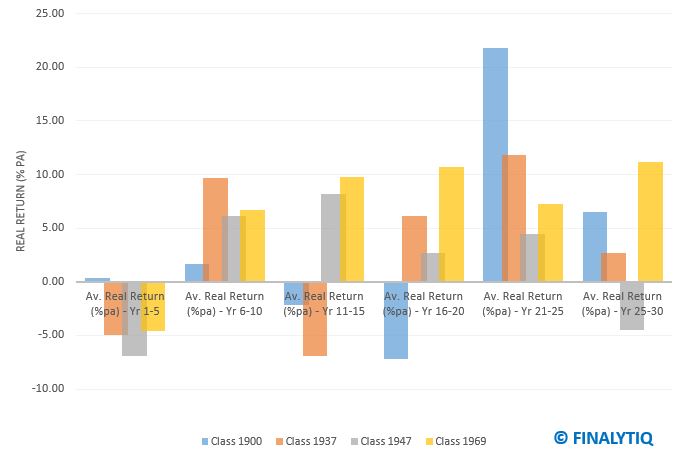
Using the DMS database, I analysed the real return of a UK 50/50 portfolio for these for periods to demonstrate how sequence risk was the root cause of the low withdrawal rates in those periods. I looked at the annualised real-return (assuming no fees) in 5-year intervals for someone starting a 30 year retirement in 1900, 1937, 1947 and 1969. I call them Class 1900, Class 1937, Class 1947, and Class 1969 respectively.
The average real return over the whole 30 year period for each of of hypothetical retirees are 2.3%pa, 2.48%pa, 2.26%pa and 7.59%pa for Class 1900, Class 1937, Class 1947 and Class 1969 respectively. What this tells us is that, the average return for each period was adequate to support a withdrawal rate of at least 3%pa, even after you account for a 1% portfolio fee! Suppose sequence risk was no issue – a net real return of just 1.6%pa will supposed a withdrawal rate of 4%pa. Yet, in these 4 scenarios, thanks to the impact of sequence of return risk – i.e poor returns in the early part of retirement, a withdrawal rate of more than 2.5%pa would have resulted in the portfolio running out before 30 years.
The chart below shows the real impact of sequence risk; all but Class 1900 have a negative real return in the first 5 years of their retirement. And if you add 1% portfolio fee (as Morningstar research), the first 5 years of their retirement would have been truly horrific.
The implication of this is that, suppose they started their retirement taking a 3% initial withdrawal (again net of 1% fee), a total disaster could be easily avoided by simply freezing their withdrawal in those early years (rather than increasing inline with inflation every year or even reducing it a little by say 0.25%), just to take account of the negative market condition in which they were starting their retirement. This is why I advocate using Monte Carlo models to demonstrate the impact of poor returns in the early part of retirement on the sustainability of income and more importantly, to have a plan of action pre-agreed with the client.
In other words, even for those unlucky enough to have started their retirement in the very worst economic scenarios in living memory, the SWR framework holds up pretty well, with a small modification. SWR gives us a robust framework to think about risk when drawing income in retirement, not a set-and-forget approach that most people think it.
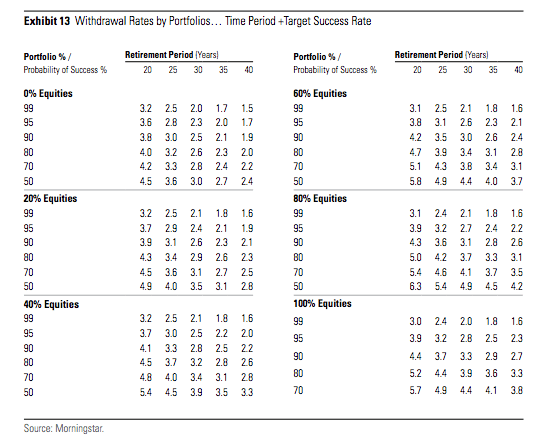
Indeed, Morningstar’s Monte Carlo model based on current market condition shows that an initial withdrawal of 3% from a 60/40 portfolio (net of 1% fee) would have a 90% probability of success, assuming a 30 year retirement!
This kind of research typically brings up the old conversation about how ‘safe’ the SWR framework really is. And people invariably make a comparison between the SWR framework and an annuity, and some folks essentially suggest that we should stop referring to it as ‘safe’. The argument is that annuity ‘guarantees’ a lifetime income and clients don’t have to worry about any probability of failure (or more precisely, entertain a slight adjustment to their income).
[bctt tweet=”Safe Withdrawal Rate gives us a framework to think about income from a retirement pot, it’s not a set-and-forget approach that people think it. ” via=”no”]
I am not anti-annuity and I believe they have a place in retirement planning, but it’s important to realise that annuities aren’t totally failsafe either. I have argued in the past that an economic scenario that is severe enough to cause the failure of the SWR framework (such as 1936/7 market condition) is also very likely to push some insurers over the edge. Indeed, even that crisis of the 1930s, just before the 2nd world war pushed the UK to technically default on the so-called inter-allied debt to the US and crisis of the the early 1970s forced the UK government to eventually seek an IMF bailout in 1976!!!
While failure of an insurer is a relatively rare event and we often look to the FSCS (and ultimately the Treasury?) as a strong line of defence in the event of an annuity provider going belly up, but the FSCS actually no experience of an annuity provider going belly up, since it was only set up in 2001, after the collapse of Equitable Life.
One argument in defence of annuities is that the increased regulatory oversight that we’ve seen in past 20 years means that insurers and reinsurers are much better capitalised than they were in the past, making defaults highly unlikely. But the reality is that I would have made the same argument about banks pre 2007! And if that’s the case, isn’t it reasonable to suggest that this all the regulatory oversight and lines of defence should equally make equity markets and the economic system less exposed to the extremes shocks? Yet, as recent as 2008, we’ve witnessed extreme shocks to the financial systems with severe consequences to banks, insurers, governments and equity markets. Perhaps most notable, is how the AAA-rated issuer AIG, almost overnight, found itself in need of a $182 billion bailout from the US government! Thankfully the US government step in and the rest is history but a natural question is ‘what would have happened to AIG annuity owners if the US government had not stepped in?
This is also worth considering in terms of a risk of systemic failure, particularly in the light of recent lower annuity sales (which impairs insurers ability to rely on generational cross-subsidy in their pricing), rising longevity and the low-yield world that we live in today. So while it’s hard to put a probability of the potential failure of annuity providers, it’s at least worth thinking of it as a possibility, with real impact for the end investor.
The point of all this is that; ‘safety’ is relative. Many clients want 100% guarantee on their retirement income; in which case they should buy an annuity and hope to avoid a systemic failure that causes the insurer and potentially the FSCS to go belly up. Many will be comfortable with an 80% to 90% success rate, knowing that in reality this means a likelihood of having to adjust their income slightly (particularly if they experience poor returns in the early part of retirement as shown about) rather than actually run out of money. And if they manage to avoid the worst possible market catastrophe or sequence of return, there is actually an upside to adopting the SWR framework since it would survive most bad economic scenarios and even leave some money on the table.
[bctt tweet=”Want a guarantee on your retirement income? Buy an annuity and hope to avoid a systemic failure.” via=”no”]
This Morningstar research falls under what I term SWR 1.0; because their are several rule-based spending strategies that enables higher initial withdrawal and update withdrawal rates in line with longevity. Some of these strategies are discussed by David Blanchett himself in this excellent paper.

He holds a Master’s degree from Coventry University and an alphabet soup of qualifications, including the Investment Management Certificate, Chartered Financial Planner, CFP and Chartered Wealth Manager designations. He was one of 5 finalists for the Professional Advisers Personality of Year Award 2015 but the award went to a more deserving winner, obviously!
Read Full Bio
A good analysis of the problem. There is of course a middle way between the DIY approach of drawdown and the “guarantees” of an insurance annuity. This used to be known as the scheme pension, and I guess it’s what the Dutch call CDC, it relies on a mutual approach not just to investment pooling but to longevity risk sharing.
i found when i gave people three options and they weren’t sure, they generally went for the one in the middle!